Infection Prevention and Control Consulting
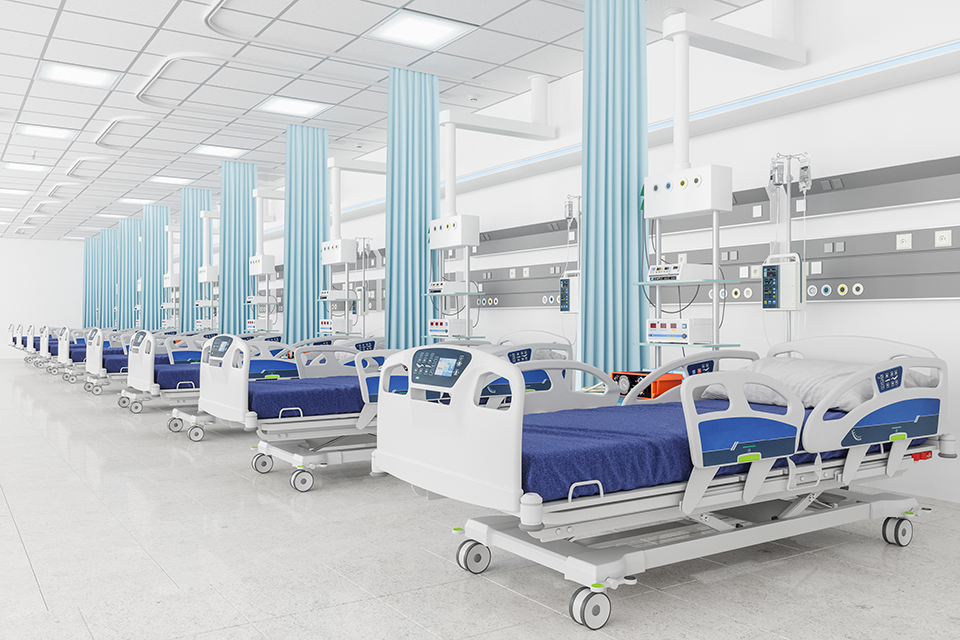
The physical environment has a powerful impact on the health and wellbeing of your building occupants. Environmental Health & Engineering’s (EH&E) multidisciplinary team of infection control specialists and building engineers helps building owners and managers keep that impact positive. We provide a range of safeguards against potential infectious organisms, including infection prevention program development, assessments, monitoring, investigation, and response services.
Our comprehensive approach is designed to meet each building’s unique needs and compliance requirements. To do so, we bring to each engagement a diverse team that includes certified safety professionals, certified industrial hygienists, microbiologists, environmental health scientists, and professional engineers. Our blend of best-in-class expertise gives organizations the benefit of more nuanced insight into the sources of potential environmental and facility risks, as well as clear solutions for moving forward.
Implement strong strategies for infection prevention
To proactively reduce the risk of infectious diseases in your facility, EH&E’s experts can develop infection risk management plans that align with relevant industry standards and best practices. Plans evaluate existing conditions, establish benchmarks, and identify risk factors unique to your environment, operations, and stakeholder needs. Our team can also help you prepare your team by defining clear infection prevention roles and responsibilities, establishing relevant processes for mitigating risk, and detailing the documentation required to demonstrate compliance and mitigate potential liability.
Make risk communication a part of your infection prevention strategy
As infection prevention and control strategies move beyond healthcare facilities to educational institutions and all types of workspaces, infection risk communication has become an essential component of every infection prevention and control strategy. Through digital dashboards, reports, guides, and other tools, we help organizations communicate with appropriate stakeholders the steps taken to keep building occupants safe.
Examples of our work include several guides developed to communicate COVID-19 response protocols: the American Camp Association and YMCA of the USA’s Camp Operations Guide, the Aviation Public Health Initiative’s report on the risks of SARS-CoV-2 transmission during time spent in airports, and the National Business Officers Association’s Operating Guidance for Independent School Pandemic Management.
- Commissioning for Optimal Performance, Infection Prevention, and Resiliency
This targeted recommissioning process assesses your building systems with a focus on mitigating risk while meeting specific operational goals, such as increasing airflow or filtration during certain periods to mitigate infectious risk or recirculating air during times of dangerous outdoor air conditions. Whatever your goals might be, EH&E’s experienced engineers work hand-in-hand with experts in building air quality and infection prevention to identify the optimal performance parameters in accordance with recognized best practices, and return to as-designed – or better – performance when the time is right. Better still, this process brings building owners and managers closer to true building resiliency, by providing invaluable insight into how much flexibility exists in systems and how they can be appropriately adjusted to achieve desired operational objectives.
- COVID-19 Consulting
We provide organizations with accurate information and expert guidance to help navigate their COVID-19 prevention and response management. Our experts can assist with ventilation and filtration system monitoring, adaptation, and commissioning that ensures performance is in line with CDC and ASHRAE recommendations during or after a COVID-19 outbreak. We also provide workspace cleaning and decontamination expertise, guidance on personal protective equipment planning and usage, and insight for effective Emergency Operations Plans (EOPs) development and response training.
- Infection Control Risk Assessment
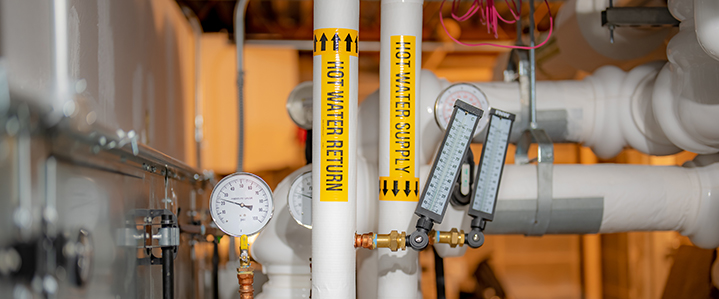
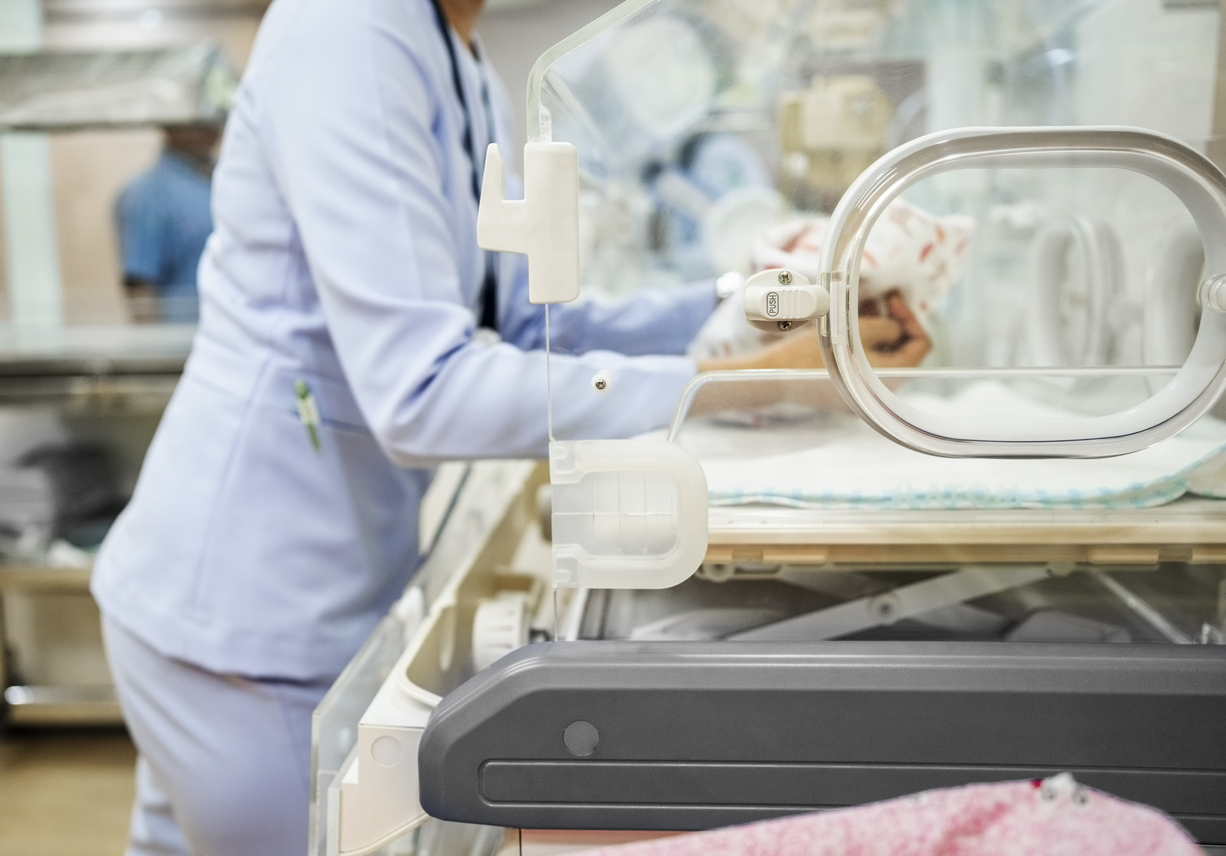
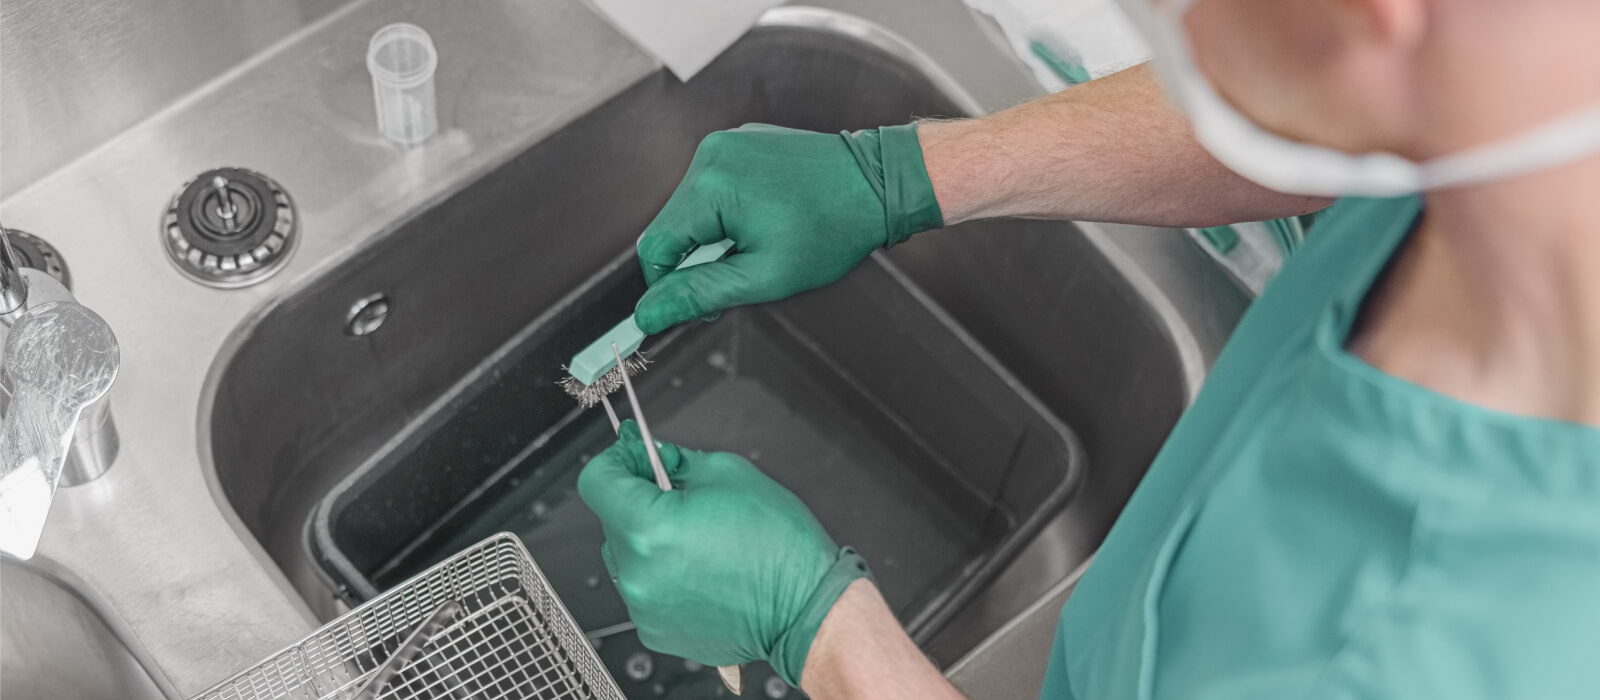
Using defined processes, including healthcare-specific ICRA strategies, EH&E helps organizations assess water, ventilation, and other essential building systems to control the risk of potential infectious organisms reaching their vulnerable populations. Our diverse range of expertise helps us to identify the source of potential risks, as well as potential pathways by which these risks may reach vulnerable building occupants. In addition to performing or supporting your risk assessment process, our team can advise on and implement mitigation measures to eliminate future risks.
- Outbreak/Cluster Investigation & Response
Outbreaks can occur even with the best planning in place. EH&E’s multidisciplinary team is equipped to respond at the first indication of an outbreak or isolated case of infection. In fact, EH&E specializes in particularly daunting infection issues that defy easy investigation. Our experts can provide testing to rapidly identify sources of infection, epidemiologic investigations that identify causative factors, and exposure and risk analyses. With this understanding, our building engineers can develop strong remediation plans and oversee implementation.
- Prevention & Monitoring Programs
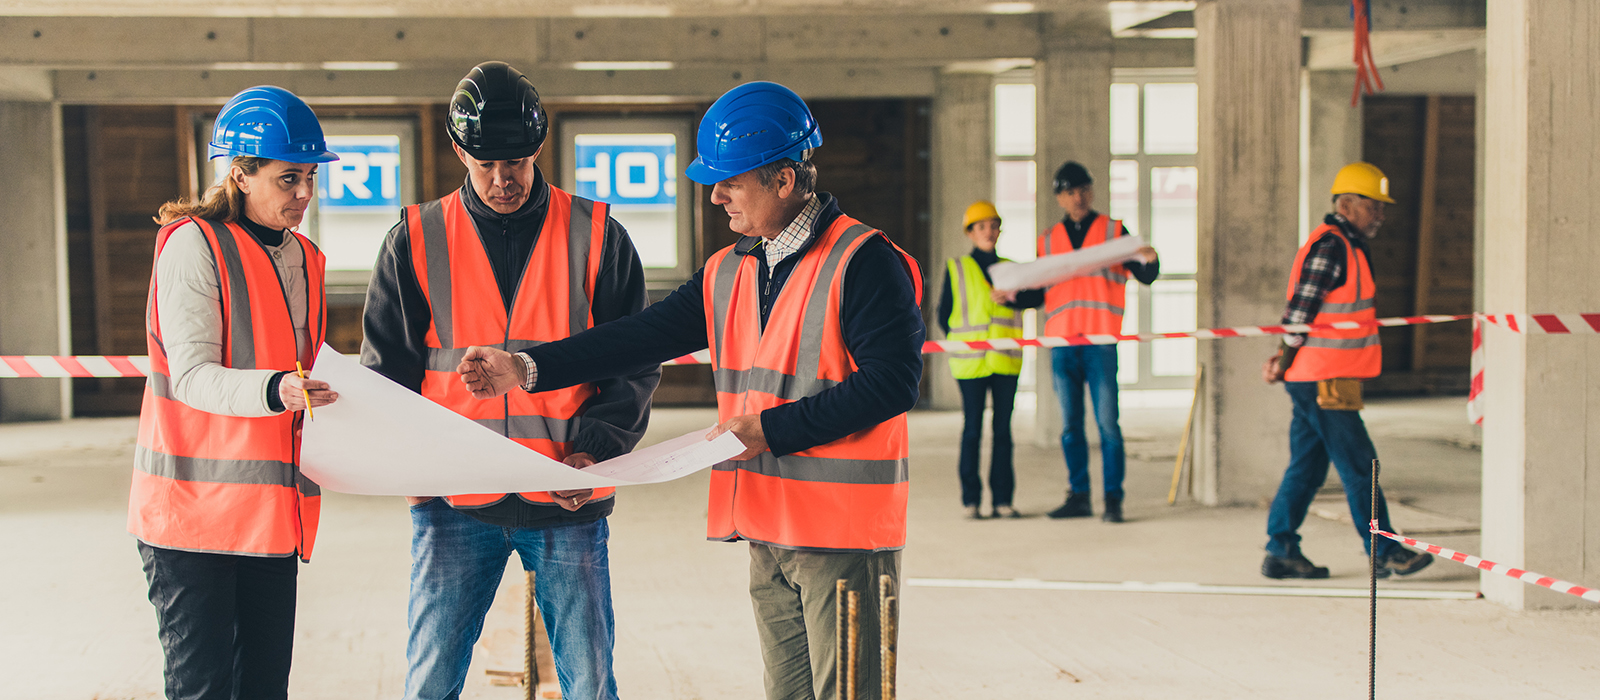
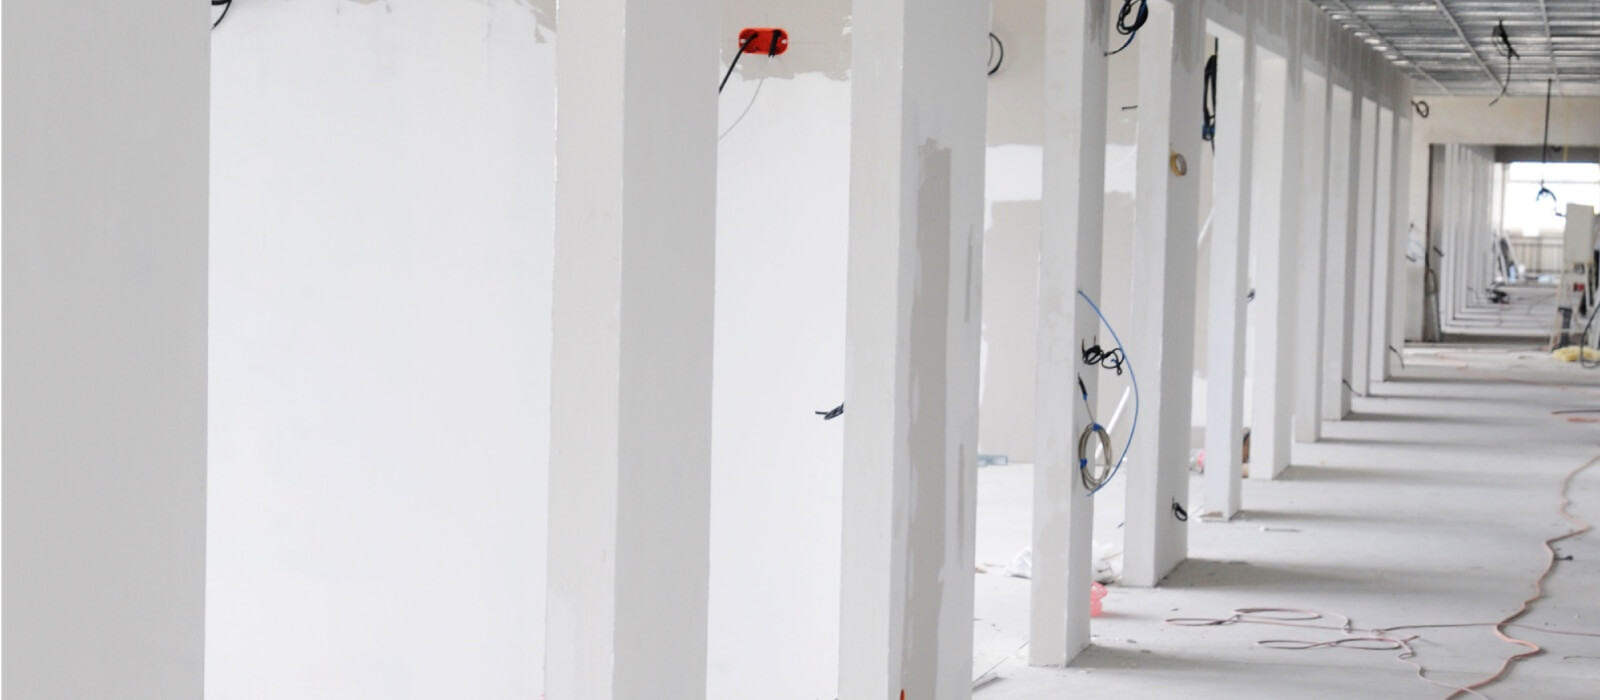
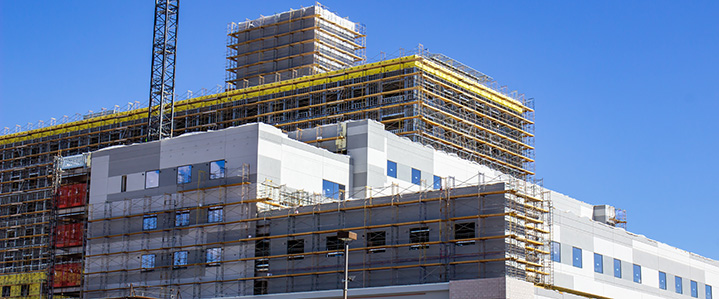
Whether you need support in structuring your infection prevention program, or long-term or continuous monitoring for certain infectious organisms, EH&E can help. We provide risk prevention planning and monitoring services for water and other essential building systems, as well as construction sites located near vulnerable populations. Paired with dashboards and real-time alerts as conditions change, your teams can trust that they’ll be able to take action to update control strategies before risks emerge.
- Respiratory Protection
EH&E supports healthcare organizations with respirator fit testing and use recommendations to meet their changing needs. Following OSHA requirements and AIHA recommendations, we ensure your team is protected against your targeted hazards. Our team can also provide the program planning, documentation support, and training that keeps you in compliance.