EH&E Study Reveals Building Decarbonization Trends Under Municipal Disclosure Ordinances
As property owners nationwide face increasingly stringent building performance expectations, a new study by EH&E finds decarbonization progress under municipal disclosure ordinances, with progress varying significantly by building sector.
Boston and Cambridge, Massachusetts, have some of the longest building performance records available for U.S. metropolitan areas. EH&E’s analysis, currently in peer review and available as a preprint, examines eleven years (2014–2024) of building energy and greenhouse gas (GHG) emissions data reported under Boston’s Building Emissions Reduction and Disclosure Ordinance (BERDO) and Cambridge’s Building Energy Use Disclosure Ordinance (BEUDO). Both cities require large buildings to report and progressively reduce their emissions toward net-zero carbon goals.
The overall trends found in EH&E’s study are encouraging, but the actionable information for building owners nationwide lies in the details: decarbonization progress and pathways vary significantly across building types and individual properties.
Encouraging Trends, Uneven Patterns
Between 2015 and 2024, total reported emissions fell 13.7%, even as reported gross floor area grew 30.8%, reflecting growing participation and Boston’s expansion of reporting requirements to smaller buildings. Two metrics show how building performance improved despite that growth. Energy Use Intensity (EUI), how much energy a building uses per square foot, fell 24.3%, while Carbon Intensity (CI), how much GHG a building emits per square foot, fell 37.3%.
Emissions and CI fell even as the building stock grew (2015-2024)
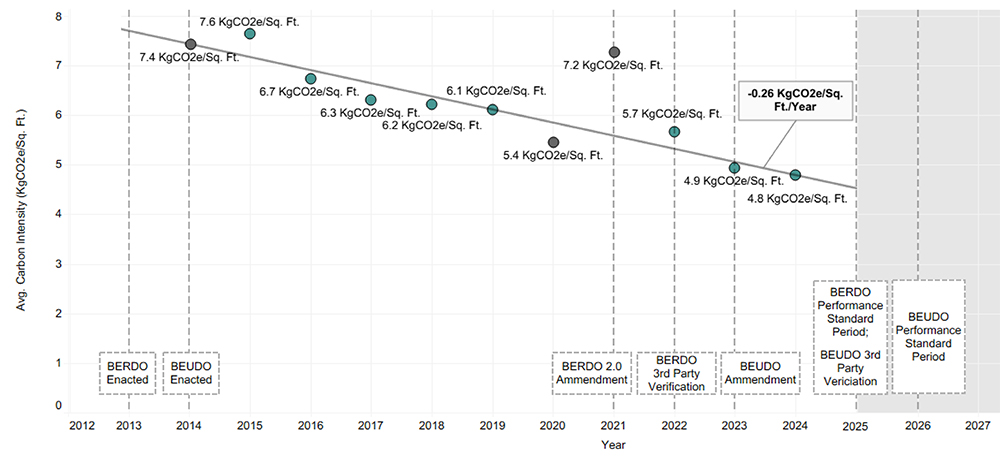
That CI fell faster than EUI is informative. More efficient energy use alone would cause EUI and CI to change together. Part of the gap reflects a cleaner regional electric grid. As New England retired coal-fired plants and added natural gas, wind, and solar, the grid’s emission rate fell 14.8% between 2015 and 2024. Buildings that switched fuels or applied qualifying renewable energy credits likely contributed as well.
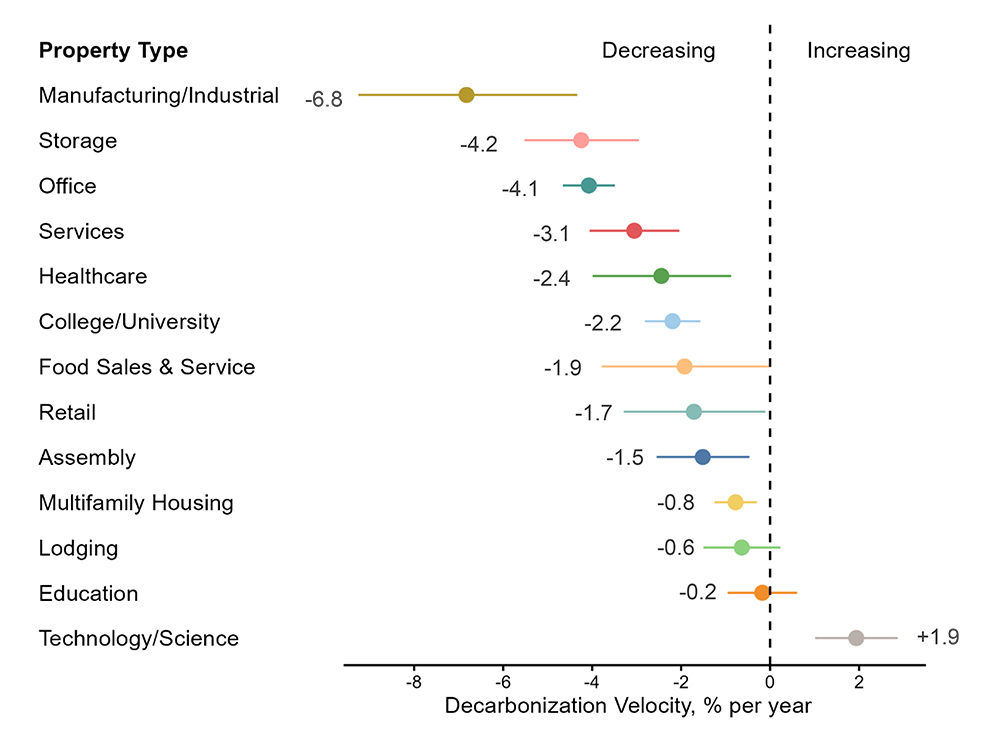
The 37.3% CI decrease captures all reporting buildings together and does not account for the expansion of reporting or other factors that impact CI. To get a clearer picture, EH&E analyzed the same buildings over time and accounted for building sector, city, and weather. With those adjustments, the typical building’s CI fell 1.6% per year. That figure hides wide differences by sector, from a 6.8% annual decline for Manufacturing/Industrial to a 1.9% annual increase for Technology/Science, the only sector where CI rose.
Even within a sector, performance data need to be evaluated at the building level before drawing conclusions. Differences between individual buildings explained 62.5% of the variation in CI, far more than sector, city, weather, and year combined. In other words, buildings in the same sector can perform very differently, and reporting practices may also play a role since the data are self-reported. A strategic energy management plan must be built from a specific building’s own record—its systems, fuels, occupancy history, and reporting history—rather than from its sector classification.
Building-level work like this, including strategic energy management and decarbonization planning, requires experts who can read a building’s data and know what its systems can actually do. EH&E combines data analytics with building engineering and systems expertise to support building owners, from compliance reporting to modeling and implementing cost-effective paths to meeting emissions limits.
Sector Highlights
Five sectors produced 80.8% of all reported emissions from 2014 to 2024. Here is how each performed and what the numbers behind them reveal.
Healthcare ─ Hospital systems run 24/7 and are among the most carbon-intensive buildings in the data. Over the study period, the CI of a typical Healthcare building fell 2.4% per year, likely reflecting documented energy reduction and decarbonization measures such as combined heat and power systems, solar panels, fuel cells, and low- and zero-carbon energy contracts for steam and electricity. That trend is consistent with EH&E’s other work in this sector, including our Metropolitan Boston Health Care Energy & Greenhouse Gas Profile, produced with Health Care Without Harm on behalf of the Boston Green Ribbon Commission.
College/University ─ This sector has relatively large absolute emissions and moderate CI, reflecting a mix of buildings with very different uses, such as carbon-intensive laboratories and lower-intensity residences. The CI of a typical College/University building fell 2.2% per year, about the same pace as Healthcare. This sector made up 13.8% of reported floor area across the two cities (22.0% in Cambridge versus 6.4% in Boston) and produced 14.6% of all reported emissions from 2014 to 2024.
Technology/Science ─ This was the only sector where the CI of a typical building rose (1.9% per year). However, a building-by-building analysis tells a more complete story: of the 162 buildings with at least three years of reported data, 69.1% show declining CI. The sector-wide increase is driven primarily by a small group of buildings that reported near-zero to moderate CI in early years, most likely while they were vacant, under construction, or undergoing fit-out. Their CI jumped once they opened as occupied lab or research spaces. The rise therefore reflects occupancy changes, not occupied buildings becoming less efficient.
Multifamily Housing and Office ─ These sectors have low CI and relatively uniform energy use, but their large floor area results in large total emissions: together, they accounted for 35.4% of all reported emissions from 2014 to 2024. The CI of a typical building fell 4.1% per year in Office but only 0.8% per year in Multifamily Housing. For slower-moving sectors like Multifamily Housing, split incentives between owners and tenants are a common barrier to addressing decarbonization.
Decarbonization velocity varies sharply by building sector
From Disclosure To Performance Standards
In the United States, buildings account for about 28% of total national energy consumption, 74% of national electricity consumption, and 13% of GHG emissions. In urban areas, their share is even larger. For instance, buildings in Boston and Cambridge are estimated to be responsible for 60% to 70% of their respective municipal GHG emissions.
To reduce those emissions, cities and states began adopting building energy benchmarking and disclosure policies in the late 2000s, led by Washington, D.C. (2008) and New York City (2009). These policies required properties to measure, report, and publicly disclose their energy consumption. Boston and Cambridge adopted reporting-only ordinances in 2013 and 2014, respectively, and both have since added emissions reduction requirements.
In 2021, Boston amended its ordinance, creating BERDO 2.0. The amendment expanded the reporting pool and set emissions standards beginning in 2025, with a target of net-zero carbon emissions by 2050. Non-compliant buildings face substantial penalties: $150 to $300 per day (depending on building size) for reporting violations and $300 to $1,000 per day for emissions standard violations. Owners can also make Alternative Compliance Payments of $234 per metric ton of CO2e over the limit.
Cambridge amended its ordinance, BEUDO, in 2023 and set an even more ambitious target: non-residential buildings over 100,000 square feet must reach net-zero carbon emissions by 2035, and those between 25,000 and 99,999 square feet by 2050. The first compliance period for emissions reductions began in 2026, and buildings that exceed their limits face fines or can purchase Alternative Compliance Credits.
The EH&E study covers the years before these standards took effect, offering a long-term view of how buildings performed when disclosure was the only requirement.
More insights from EH&E’s study are available in this preprint article: Building Sector Carbon Use Trajectories Under Evolving Disclosure and Performance Standards: An Eleven-Year Analysis of Boston and Cambridge, Massachusetts, 2014–2024
Turning Data Into Action Nationwide
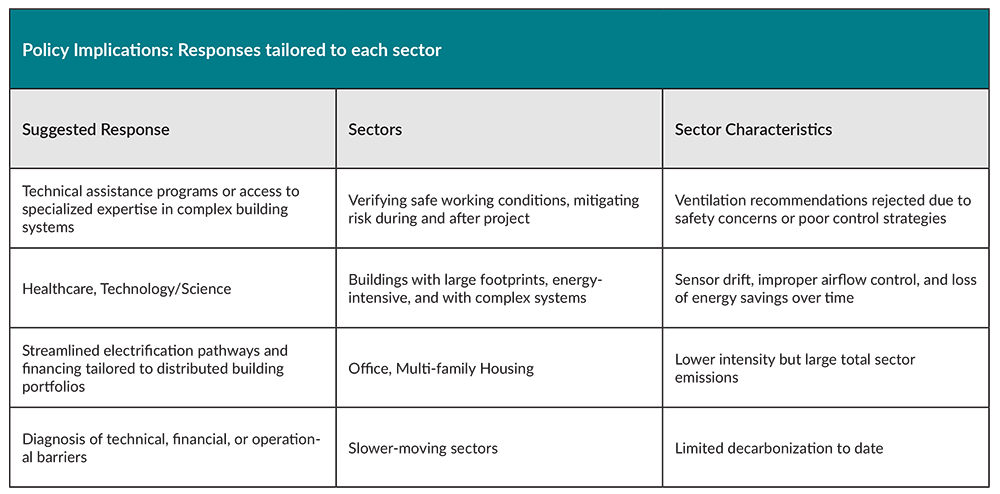
The findings point to how compliance support and technical assistance might be targeted to each sector’s needs.
The study also offers lessons for how programs manage their data. Because the pool of reporting buildings keeps changing, citywide totals alone are an imperfect measure of progress toward net-zero goals. Tracking the same buildings over time gives a clearer picture, but only if records are consistent. Programs launching or updating their requirements should assign each building a permanent identifier, link any new identifiers to historical records, and require independent verification of reported data.
For the more than sixty U.S. jurisdictions with disclosure policies and for the owners who report under them, the Boston and Cambridge record carries a clear lesson: a single portfolio-wide rate would overstate progress for some buildings and understate it for others. The best plans, for programs and building owners alike, start with building-level data.
Tools For Meeting Decarbonization Goals
Alongside its analysis, EH&E has developed a public-facing dashboard where anyone can look up a building by address to see its reported GHG emissions and energy use over time. Building owners, policymakers, and community members can also use it to compare performance by building sector across the two cities.
For building owners, EH&E offers large building reporting support services. As property owners strive to meet sustainability goals and navigate evolving compliance mandates like BERDO and BEUDO, EH&E’s proprietary interactive modeling tool helps them plan cost-effective paths to compliance. By evaluating equipment upgrades, capital costs, and operational savings, EH&E’s tool enables owners to model multiple scenarios and prioritize strategies that align their long-term financial targets with local emissions standards.
Whether you are looking to turn complex data sets into actionable insights or need guidance structuring a long-term decarbonization strategy, EH&E’s experts are here to assist. Contact our team today to discuss your specific needs.

For a step-by-step approach to decarbonization and how to leverage energy savings from building performance optimization, see our article: Decarbonization Planning: Step-by-Step Strategies Fueled by Performance Optimization Savings.




Subscribe
to our blog
"*" indicates required fields